Why Activation Functions Are Required - Explained Using Colah's Blog
Understanding the Need for Activation Functions
Colah’s blog explains why activation functions are needed in neural networks very well, but the concepts can be challenging to grasp. In this post, I’ll simplify these ideas to make them more accessible.
Starting with a Simple Dataset
Let’s consider the same dataset used in Colah’s blog:
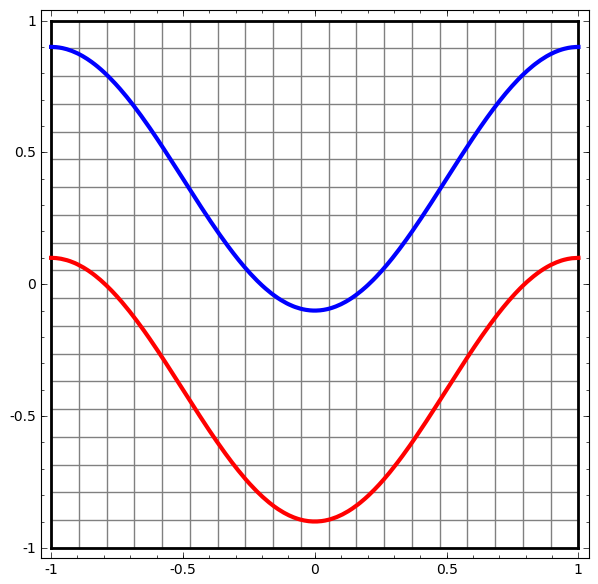
Linear Model Without Hidden Layers
Without hidden layers, a neural network can only create a simple linear decision boundary separating the data points:
As you can see, a simple linear boundary cannot properly separate our non-linear data.
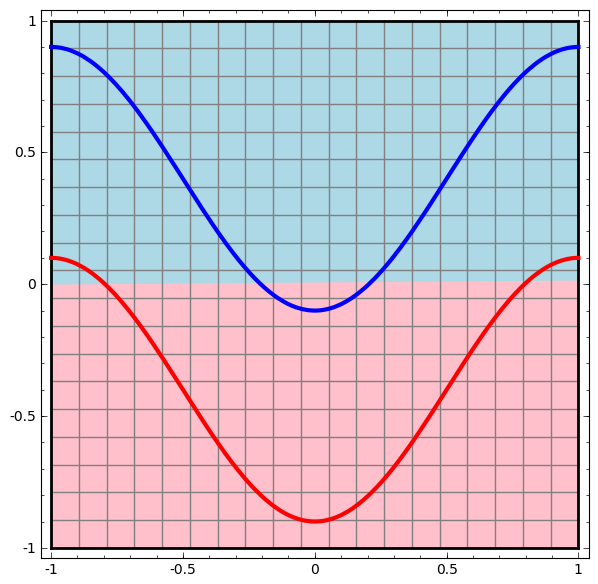
Adding a Hidden Layer
When we add a hidden layer to our network:
With this hidden layer, the network can now separate the data with a more complex curve. As data passes through each layer, we get a new representation of our data:
Understanding the Transformation Process
The above image might seem confusing at first, so let’s use a simpler analogy to understand what’s happening:
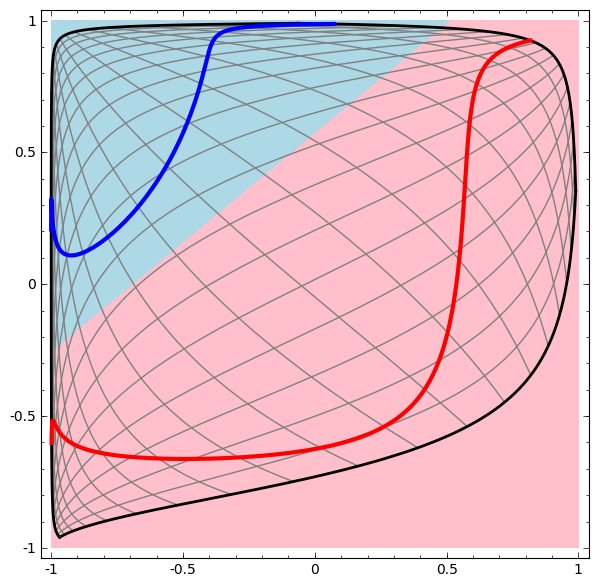
Imagine you’re playing a game where you need to separate blue and red balls scattered on a square table. Your goal is to create a rule that perfectly separates them.
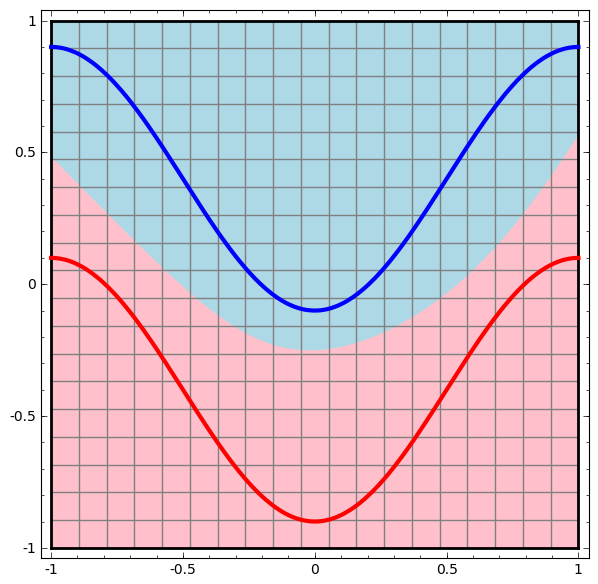
- The Square Table (Black Outline): This represents your input space, ranging from -1 to 1 on both axes.
- Blue and Red Regions: These show how the neural network has decided to classify each part of the table.
Notice that the dividing line between blue and red regions isn’t a simple straight line—it’s curved and complex. This complex boundary is what a neural network with hidden layers and non-linear activation functions can achieve. A simple linear classifier could only draw a straight line, which wouldn’t separate these regions effectively.
In the last image we can see that these gray grid lines are no longer perfectly straight and evenly spaced? They’re warped and curved. If you could now put this warped gray grid on a new table, the neural network would find it very easy to draw a simple straight line to separate the blue and red regions. The complex curving you see in the background of the image (the boundary between light blue and light red) is actually a straight line in the “transformed” world created by the hidden layer, but when we project it back onto our original simple square table, it looks all bent and wiggly.
The neural network is like a smart cookie that, instead of trying to draw a wiggly line directly on your table, first bends and warps the table itself (this is what the hidden layer and activation functions do, represented by the gray grid). Once the table is bent just right, it can then simply draw a straight line on the bent table to separate your blue and red balls. When you look at that straight line on the bent table from a normal perspective, it appears as the complex curved boundary you see in the image. This ability to “bend the space” is why neural networks can solve very complicated classification problems.
We can see the visualization after hidden layer below: